| Forward Search in Linear Regression | Forward Library Help
|
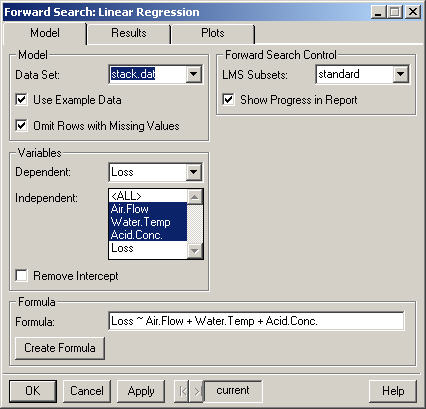
The data to be used in the Forward Search. By default only the data frames in the current working directory are displayed. However, any data frame on the search path (for instance fuel.frame) may be selected by typing its name into the Data Set combo box.
Selecting this option causes the Data Set combo box to list the data frames containing the example data provided with the Forward Library. Additionally, when this option is selected the formula will be filled in automatically.
If this option is selected, rows in the data frame that contain missing values (NA's) will be removed. Otherwise an error will be generated if missing values are present.
Specifies the dependent variable in the linear regression model.
Specifies the independent (explanatory) variable(s) in the linear regression model. Use control-clicks to select multiple variables. For more compilcated models select the data (in the Data Set combo box) and press the Create Formula button.
Selecting this option causes the intercept term to be removed from the model.
The initial subset for the Forward Search in Linear Regression is found by fitting the regression model with the Splus function lmsreg. This option allows the user to control how many subsets are used in the Least Median of Squares regression. The choices are standard (which uses 3000 subsets) and all. Additionally, a specific number of subsets may be specified by typing a number into the LMS Subsets combo box.
Prints a message in the report window for every ten iterations completed during the forward search.
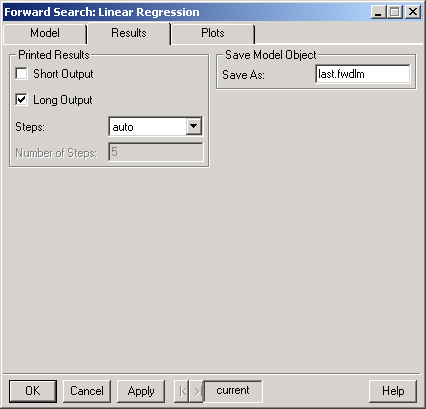
This will display a brief summary of the Forward Search.
This option provides a more detailed summary of the Forward Search. The last Steps (see below) of the diagnostic statistics monitored during the search are displayed.
Controls how many steps are shown in the summary when Long Output is selected. The default behavior ("auto") is to show either the last 5 steps or the last 10% of the search, which ever is greater. Selecting "all" will display the statistics for the entire search and selecting "user" will allow you to enter the desired number of steps in the Number of Steps field.
If the "user" option is selected in Steps then the desired number of Steps should be entered here.
The Forward Search is saved as an S object with (S version 3) class "fwdlm" in the current working directory. If you do not wish to save the results simply leave this field blank.
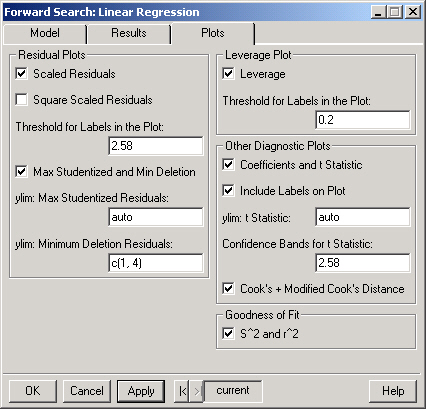
Plots the scaled residuals at each step of the forward search. Note that each line in the plot corresponds to the residual for one observation.
If TRUE the scaled residuals are replaced by the squared scaled residuals in the scaled residuals plot.
Only observations whose residuals exceed this threshold (at some point during the forward search) will be labeled in the Scaled Residuals plot.
Plots the Maximum Studentized Residual and the Minimum Deletion Residual at each step of the forward search.
The range for the maximum studentized residuals plot. This should be a numeric vector of length 2 containing the lower and upper bounds for the plot. For example, "c(0, 4.5)" (without quotes) would set the range to show values between 0 and 4.5.
The range for the minimum deletion residuals plot. This should be a numeric vector of length 2 containing the lower and upper bounds for the plot. For example, "c(1, 4)" (without the quotes) would set the range to show values between 1 and 4.
Plots the leverage for each step of the forward search.
Plots the coefficients and t statistics for each step of the forward search.
If TRUE then the lines in the coefficients and t statistics plots will be labeled.
The range for the plot of the t statistics. This should be a numeric vector of length 2 containing the lower and upper bounds for the plot. For example, "c(-3.5, 3.5)" (without the quotes) would set the range to show values between -3.5 and 3.5.
The value (on the scale of the t statistics) used to draw the confidence interval on the plot of the t statistics.
Plots the Cook's and modified Cook's for each step of the forward search.
Plots the residual variance (s^2) and the R-squared statistic (r^2) for each step of the forward search.